I Built a Multi-Agent AI Workflow to Deploy Infrastructure. Here's What Actually Happened
I Built a Multi-Agent AI Workflow to Deploy Infrastructure. Here's What Actually Happened

The Architecture: Three Tiers of Agents
The system mirrors how a traditional dev team structures their Claude Code workflows, but is tweaked for a more infra mindset. It has three layers:
Tier 1: The Orchestrator. A coordinator prompt that never writes code. It reads the project config, classifies incoming tasks, decides which specialist agents to dispatch, and enforces a verification gate before anything is considered done. Think of it as a principal engineer who delegates.
Tier 2: Seventeen Specialist Agents. Each one is a Markdown file that defines a specific domain of expertise. There are agents for AWS infrastructure, Azure infrastructure, VPN access, Kubernetes manifests, EKS operations, AKS operations, Prometheus, Grafana, AlertManager, cloud security, Kubernetes security, Trivy scanning, GitHub Actions, Azure DevOps, GitLab CI, Ansible configuration, and troubleshooting. They're split by cloud provider & by function, so the EKS agent knows about IRSA and the aws-auth ConfigMap, while the AKS agent knows about Workload Identity and managed CSI storage classes.
Tier 3: Command Workflows. These are sequences that chain agents together with approval gates. For example, /deploy-cluster runs: infrastructure agent → VPN agent → cluster operations → security baseline → monitoring stack → FINAL_VERIFY → manual steps generation. Each stage gates on the previous one, and it completes successfully.
The key design pattern is FINAL_VERIFY, every workflow requires the security and scanning agents to review everything that was produced before it's considered done. Cloud security audits Terraform; Kubernetes security audits manifests; and Trivy scans for vulnerabilities. All must approve before anything happens.
The Test: EKS Cluster from Scratch
I built the project using an interactive script that asks about cloud provider, region, container image, registry, CI/CD platform, and access method. For this test I did: AWS EKS in eu-west-2, nginx from Docker Hub, GitLab CI for pipelines, and OpenVPN for cluster access.
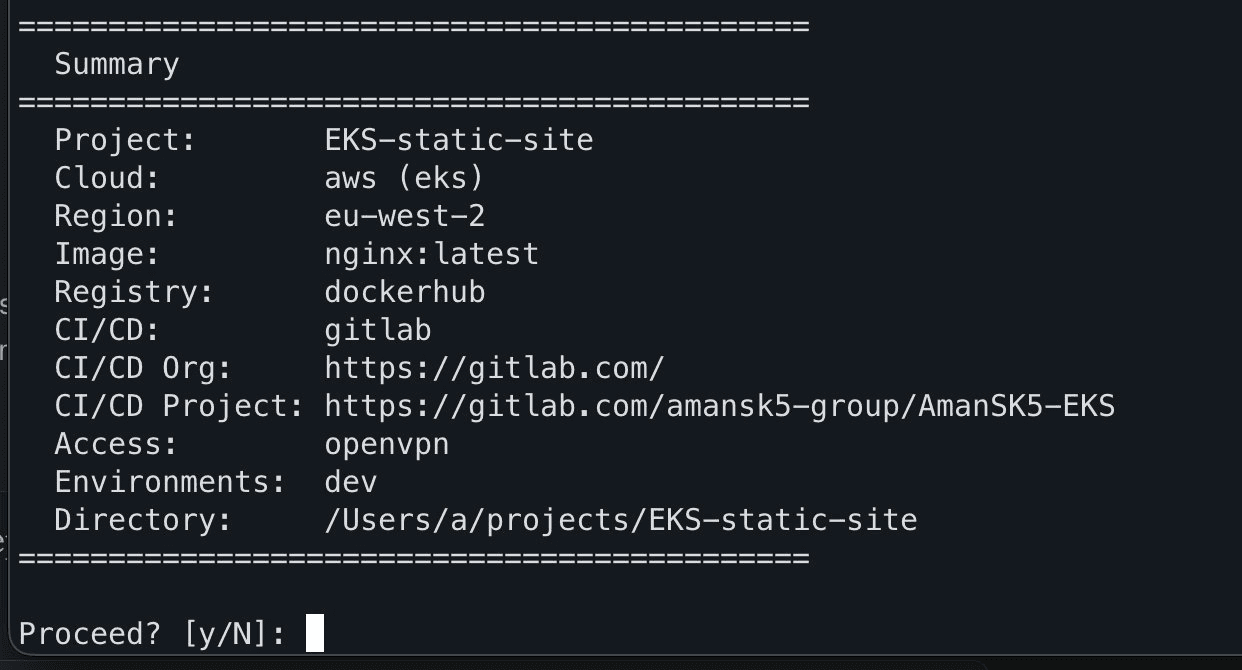
Building a new project via the interactive prompts to define the stack I want to use
This generated a project.yaml config file and copied all agents and commands into the project directory. Then I opened Claude Code and typed /deploy-cluster.
The orchestrator read the project config, identified this as an AWS/EKS deployment, and laid out a seven-stage plan:
Stage 1: AWS Infrastructure — VPC, EKS, IAM, security groups, KMS
Stage 2: VPN Access — AWS Client VPN with mutual TLS
Stage 3: EKS Operations — add-ons, storage class, IRSA, load balancer controller
Stage 4: Kubernetes Security — NetworkPolicies, PodSecurity, RBAC
Stage 5: Monitoring — Prometheus, Grafana, AlertManager
Stage 6: FINAL_VERIFY — security audit, Trivy scan, plan validation
Stage 7: Manual steps documentation
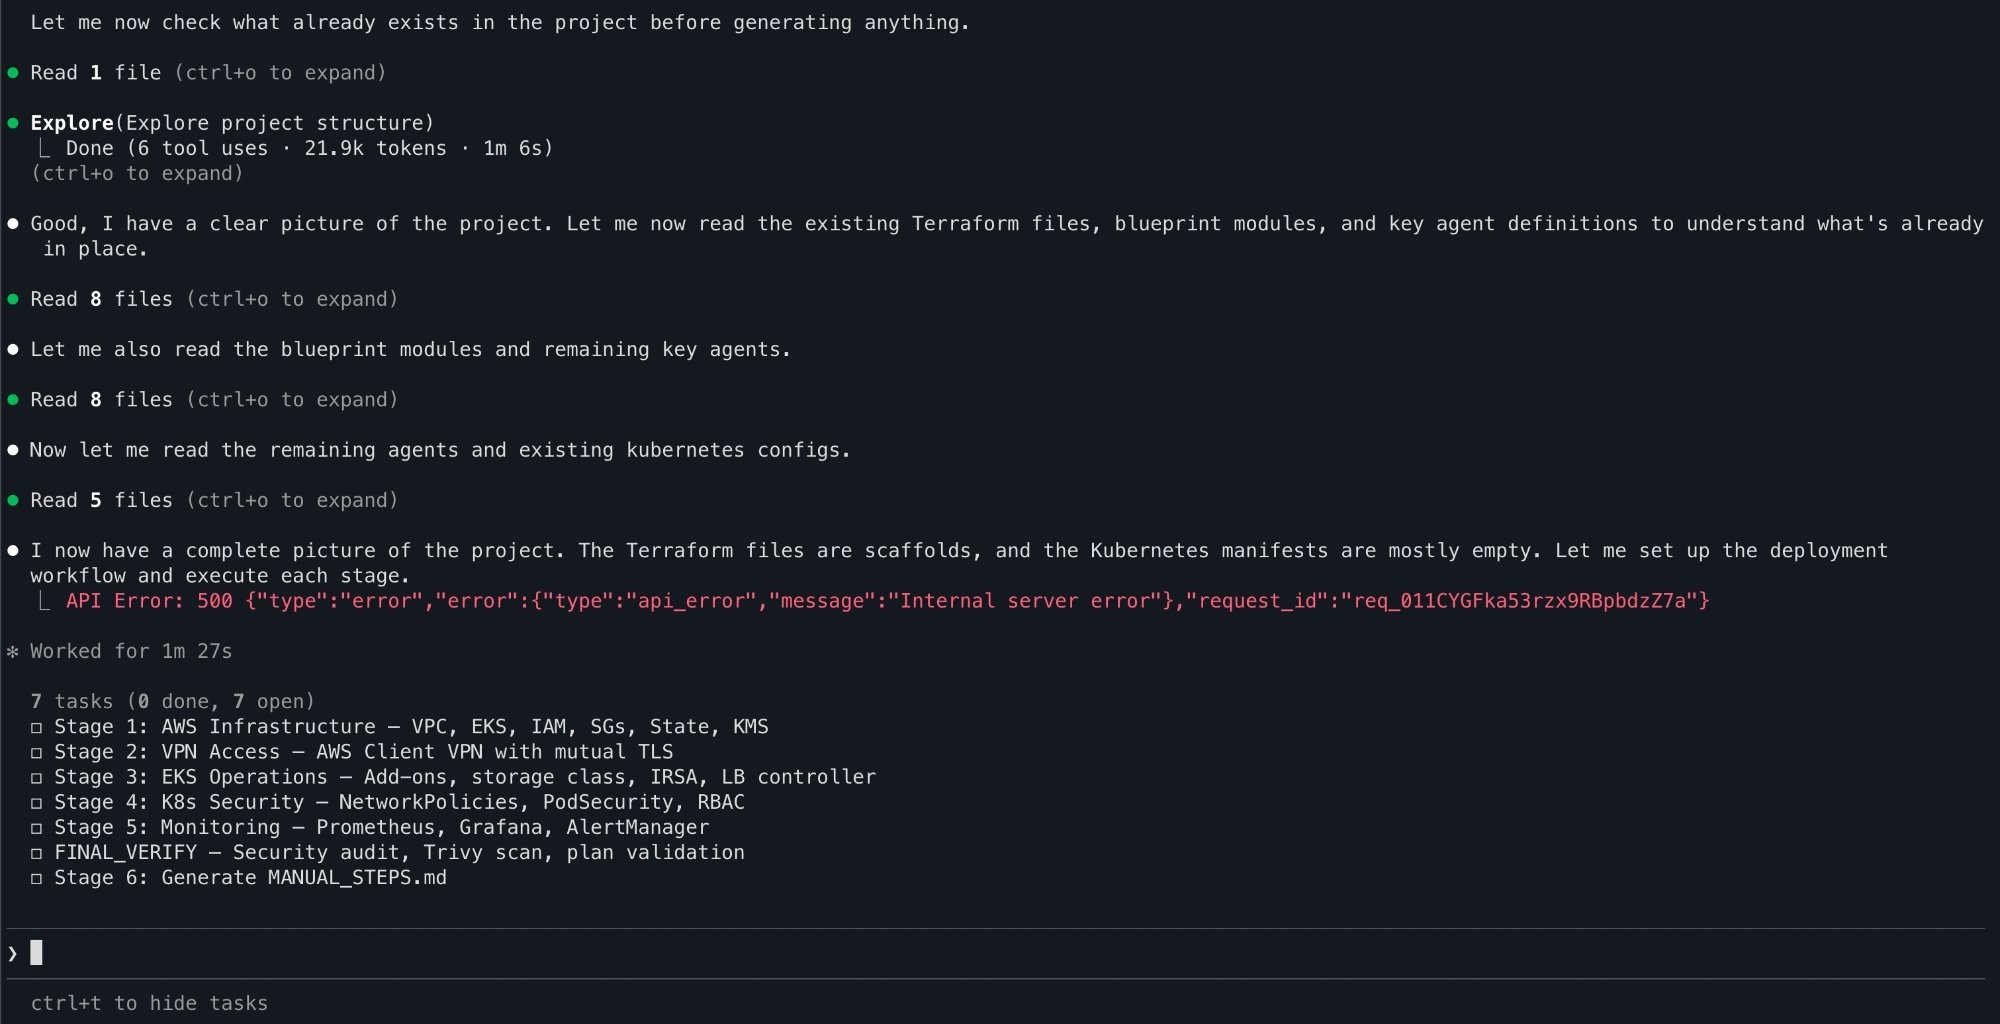
The orchestrator reads the project.yaml file and plans all seven stages
I proceeded stage by stage. Each one dispatched the relevant agent, which wrote production Terraform, Kubernetes manifests, or Helm configurations.
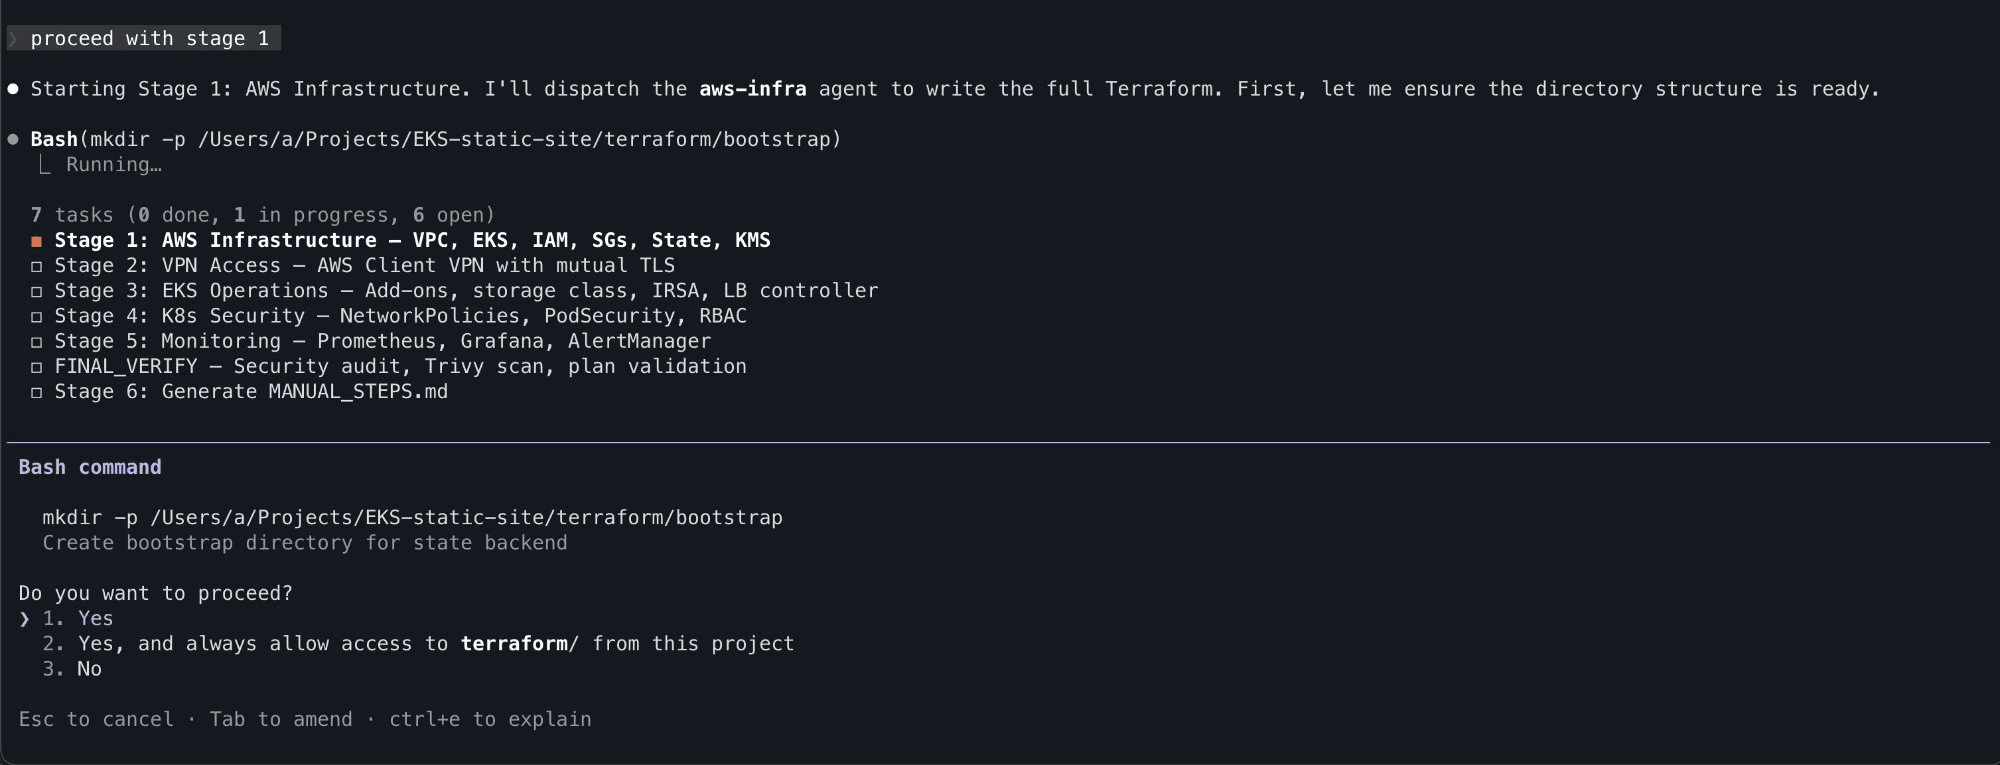
Stage 1 - The AWS-infra agent begins writing Terraform
The agents explained their decisions as they went, i.e. why private subnets for worker nodes, why IMDSv2 enforcement, why KMS for secret encryption.
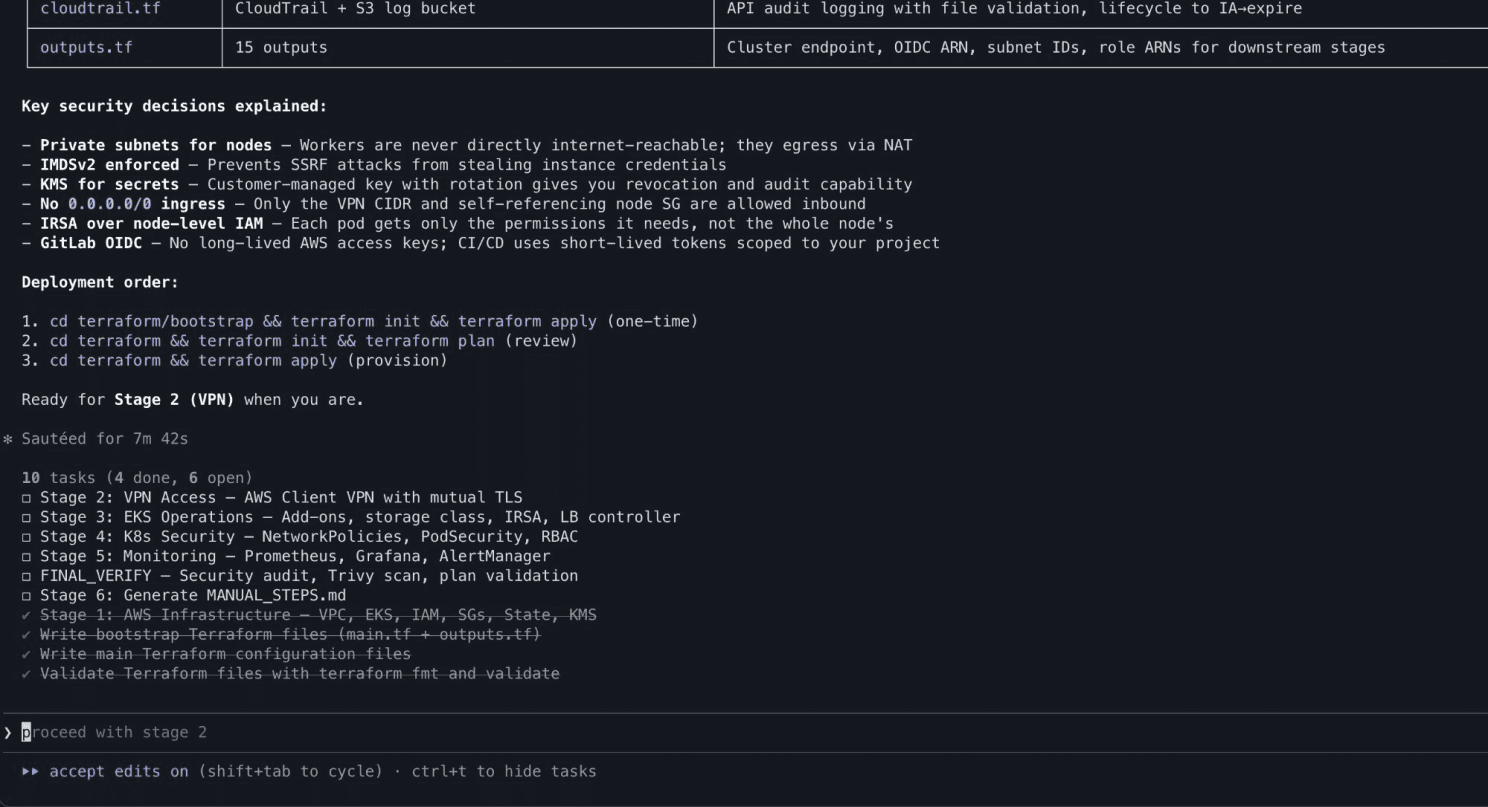
Every security decision is explained
After roughly ~35-40 minutes of code generation across all stages, the system had produced 12 Terraform files defining 78 resources, Kustomize overlays, Helm values, NetworkPolicies, PrometheusRules, Grafana dashboard ConfigMaps, AlertManager routing, and a 10 step deployment guide.
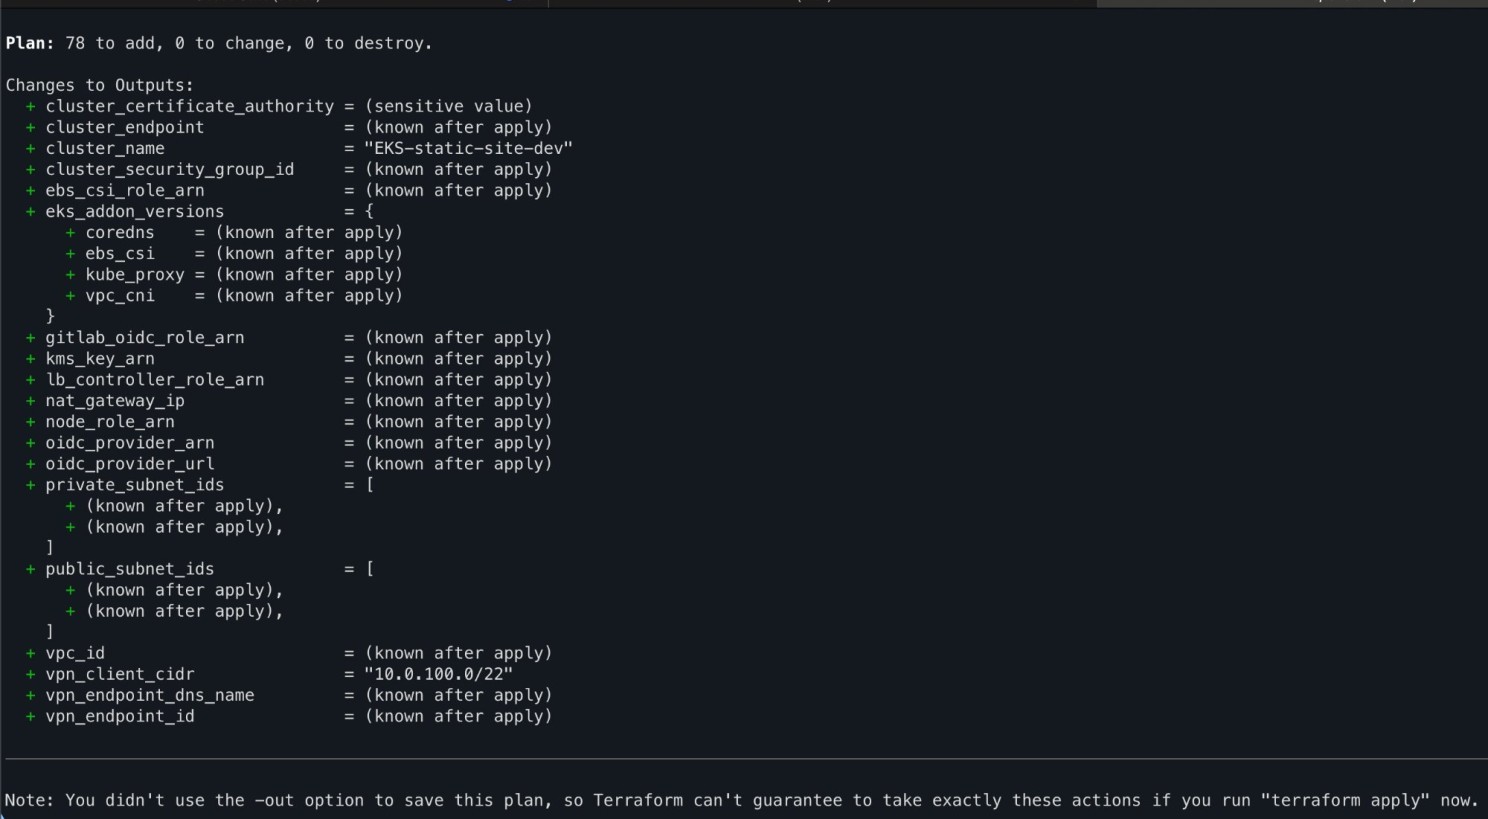
Terraform plan - 78 resources to create
The moment you see your cluster appear in the AWS Console, that’s when it becomes real. Infrastructure coming alive from a conversation.
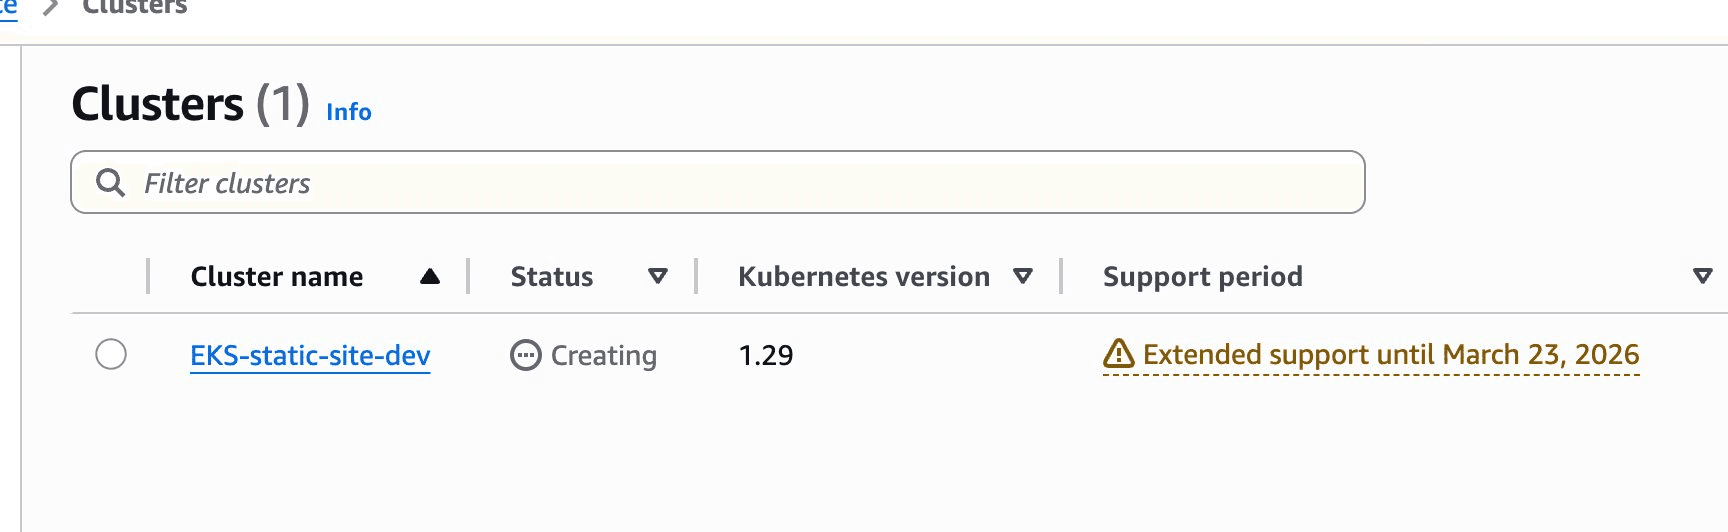
EKS being provisioned in the console
The Good
The workflow is genuinely useful. Going from zero to a fully documented, reviewed infrastructure codebase in under an hour is impressive. The agents produced proper Terraform modules, not toy examples with remote state, IAM roles, OIDC federation for GitLab CI, CloudTrail audit logging, and KMS encryption.
FINAL_VERIFY caught real issues. The security agents flagged findings during verification — single-region CloudTrail, mutable image tags, monitoring egress policies. All rated appropriately as LOW/INFO for a dev environment with notes on what to tighten for production.
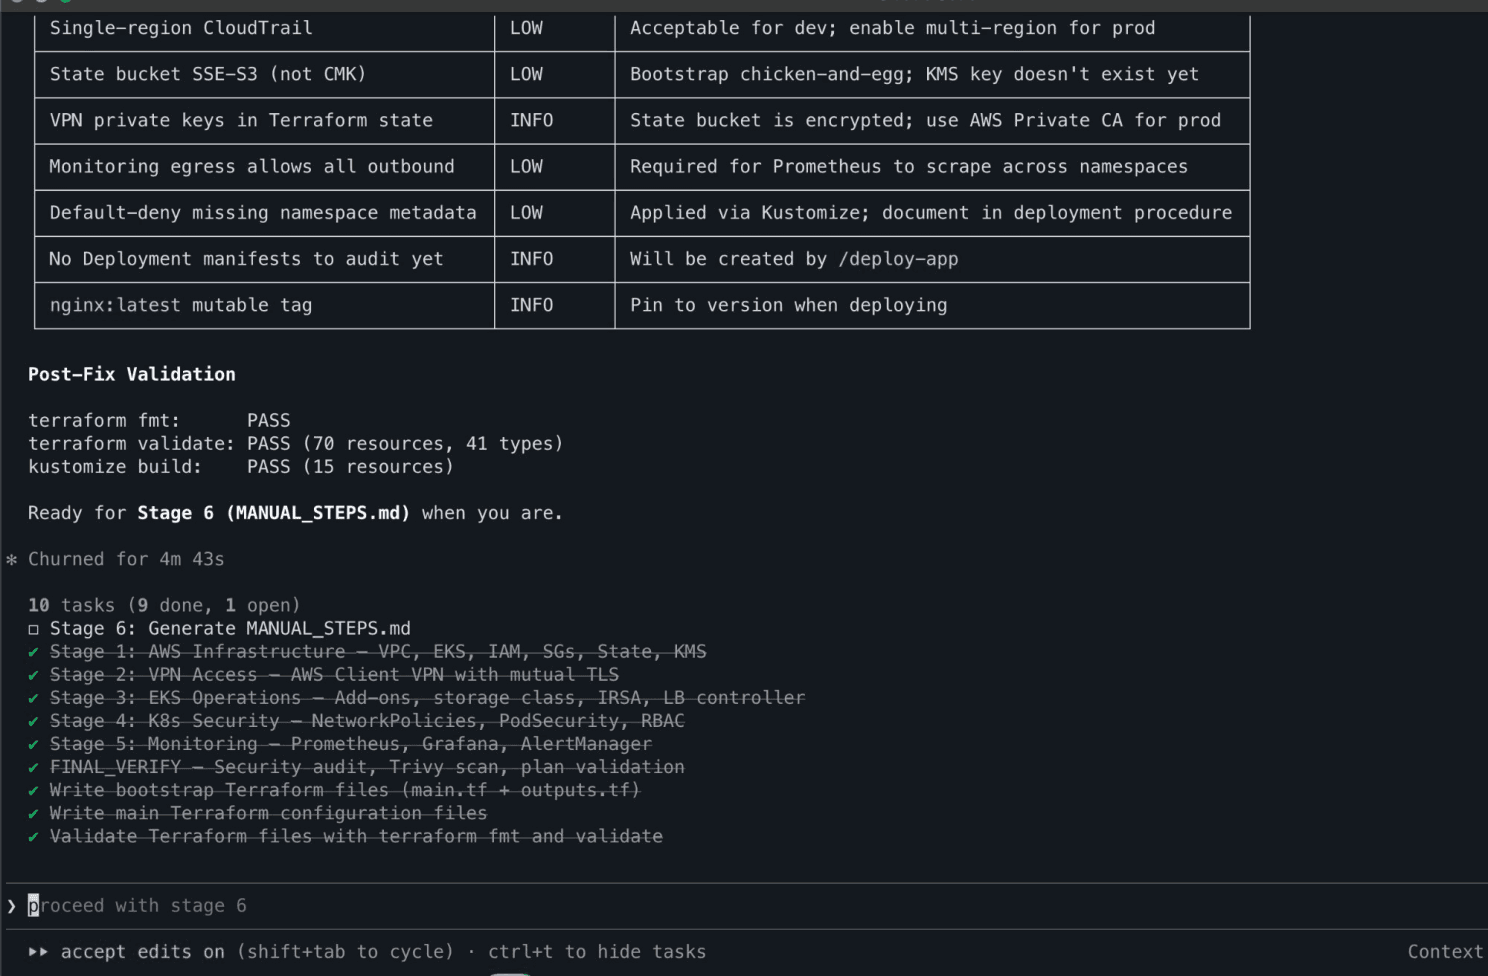
Security audit passes with low/info findings
The educational value is high. Every agent explained why it made each decision. When it configured IMDSv2, it explained SSRF credential theft. When it set up NetworkPolicies, it explained default-deny patterns. For someone learning DevOps, this is significantly more valuable than reading documentation in isolation.
The deployment guide was thorough. The generated MANUAL_STEPS.md covered everything from finding your public IP to configuring GitLab CI variables to tearing down the infrastructure, with cost estimates and scaling to zero commands for cost management.
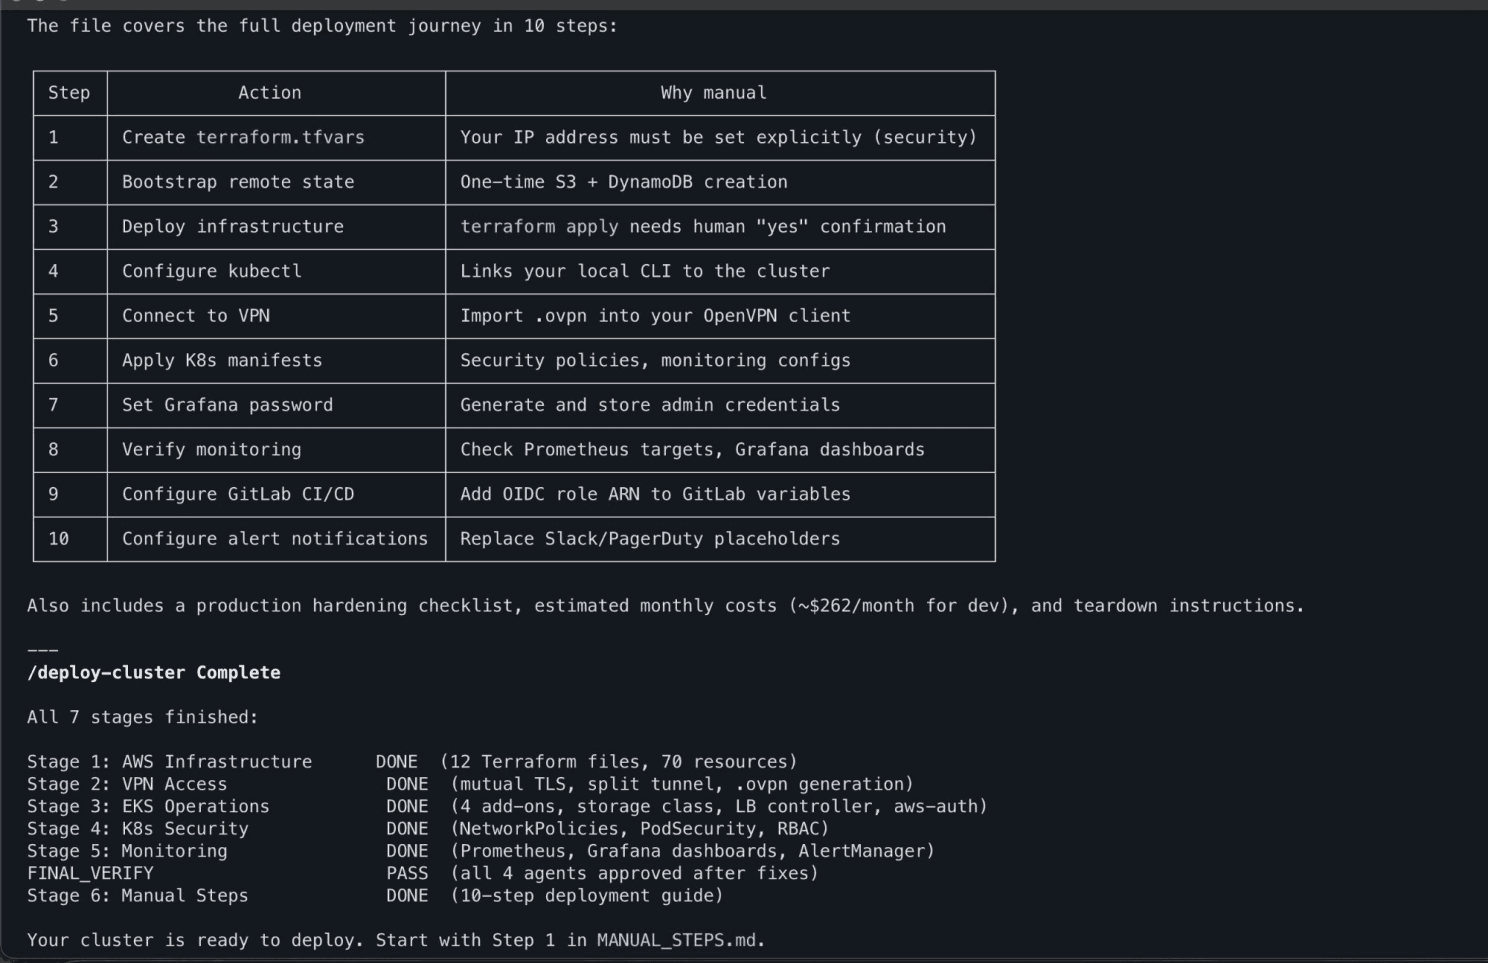
Generated deployment guide with manual steps outlined and cost estimates
Recovery from errors was smooth. When things went wrong (and they did), I could describe the errors to the agents in plain English and they diagnosed and fixed them correctly.
The Bad
Here's where it gets honest. The first terraform apply failed with three errors. The second attempt failed with two more. These weren't edge cases they were fundamental, well known constraints:
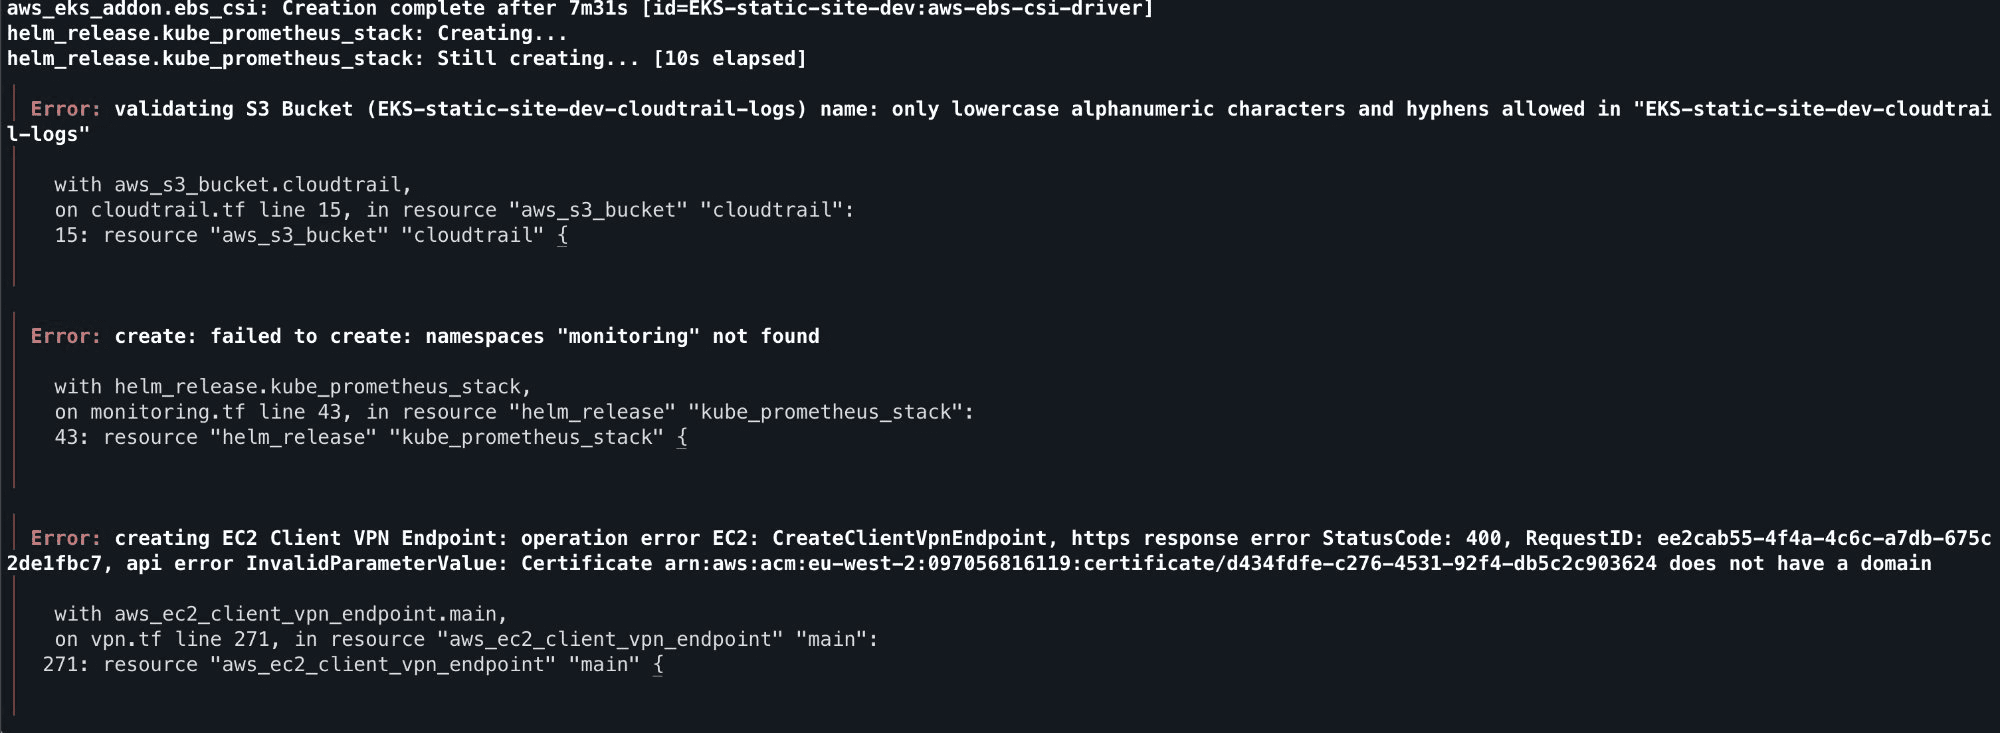
The first terraform apply output these 3 errors that the agents should've prevented
S3 bucket names must be lowercase. The project name was EKS-static-site, and the agent used it directly in a bucket name. S3 rejected it. This is day one AWS knowledge.
Helm releases need their namespace to exist first. The Prometheus Helm chart was configured with create_namespace = false, but nothing created the monitoring namespace beforehand. The chart failed immediately.
AWS Client VPN certificates require a Subject Alternative Name. The TLS certificate was generated without a dns_names field. AWS rejected it at endpoint creation.
VPN client CIDR overlapped with VPC CIDR. The VPN was assigned 10.0.100.0/22, which falls inside the VPC's 10.0.0.0/16. AWS doesn't allow this.
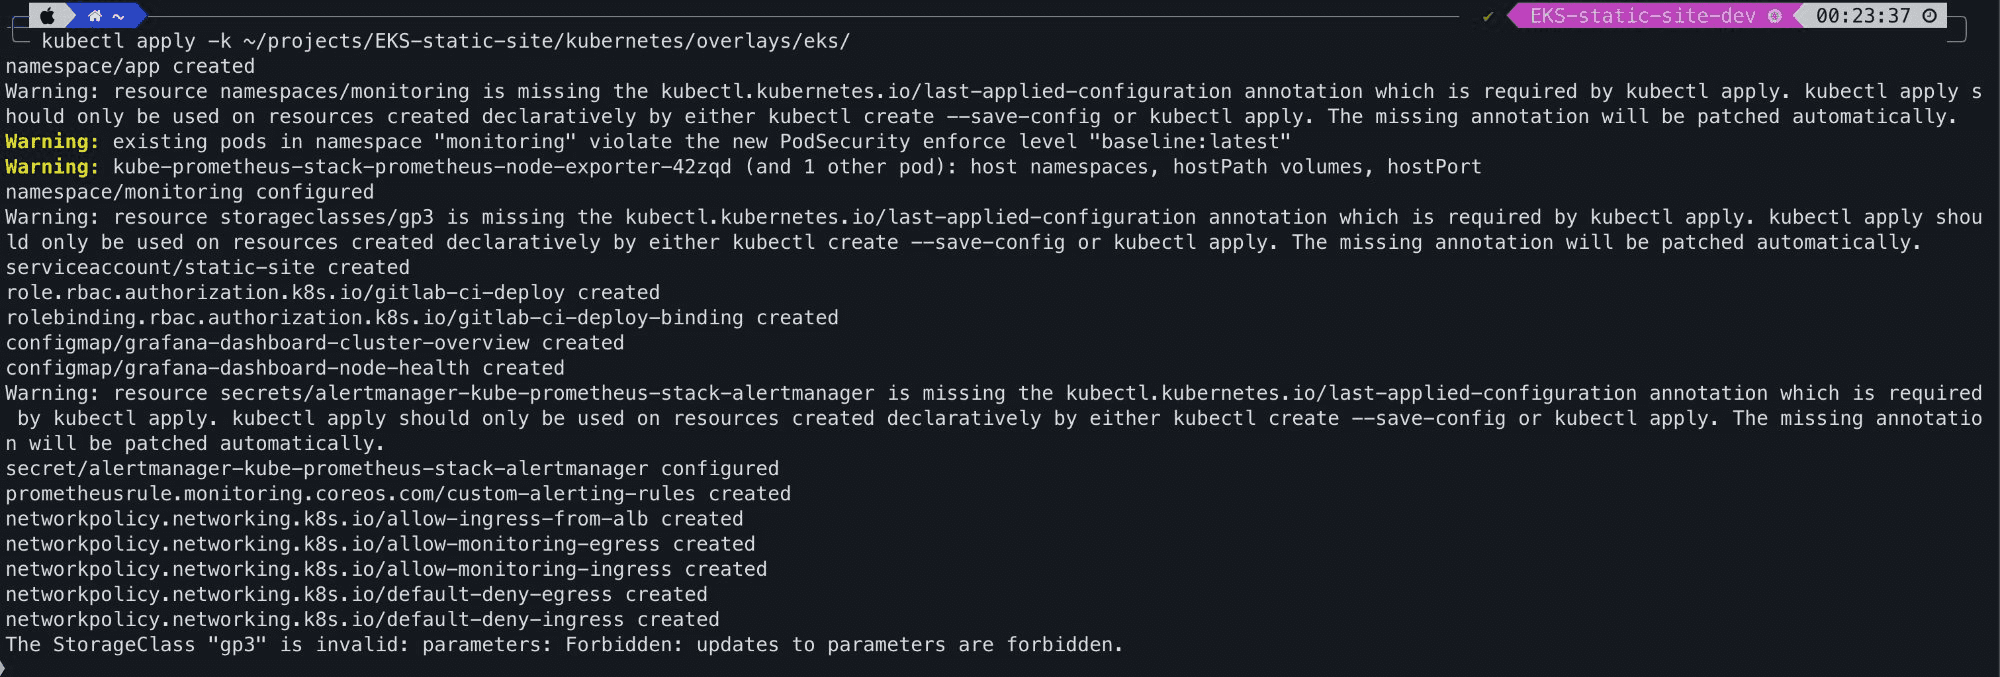
PodSecurity baseline blocked the node-exporter. The monitoring namespace was set to enforce: baseline, but node-exporter legitimately needs hostNetwork and hostPath access. Pods failed to schedule.
Every one of these is a known constraint that the agents should have handled from the start. The information was in the agent prompts in general terms ("follow AWS naming conventions"), but the agents didn't connect the dots between the specific project config and the specific cloud constraints.
To the agents credit though, when pointed at the errors they diagnosed and fixed everything correctly:
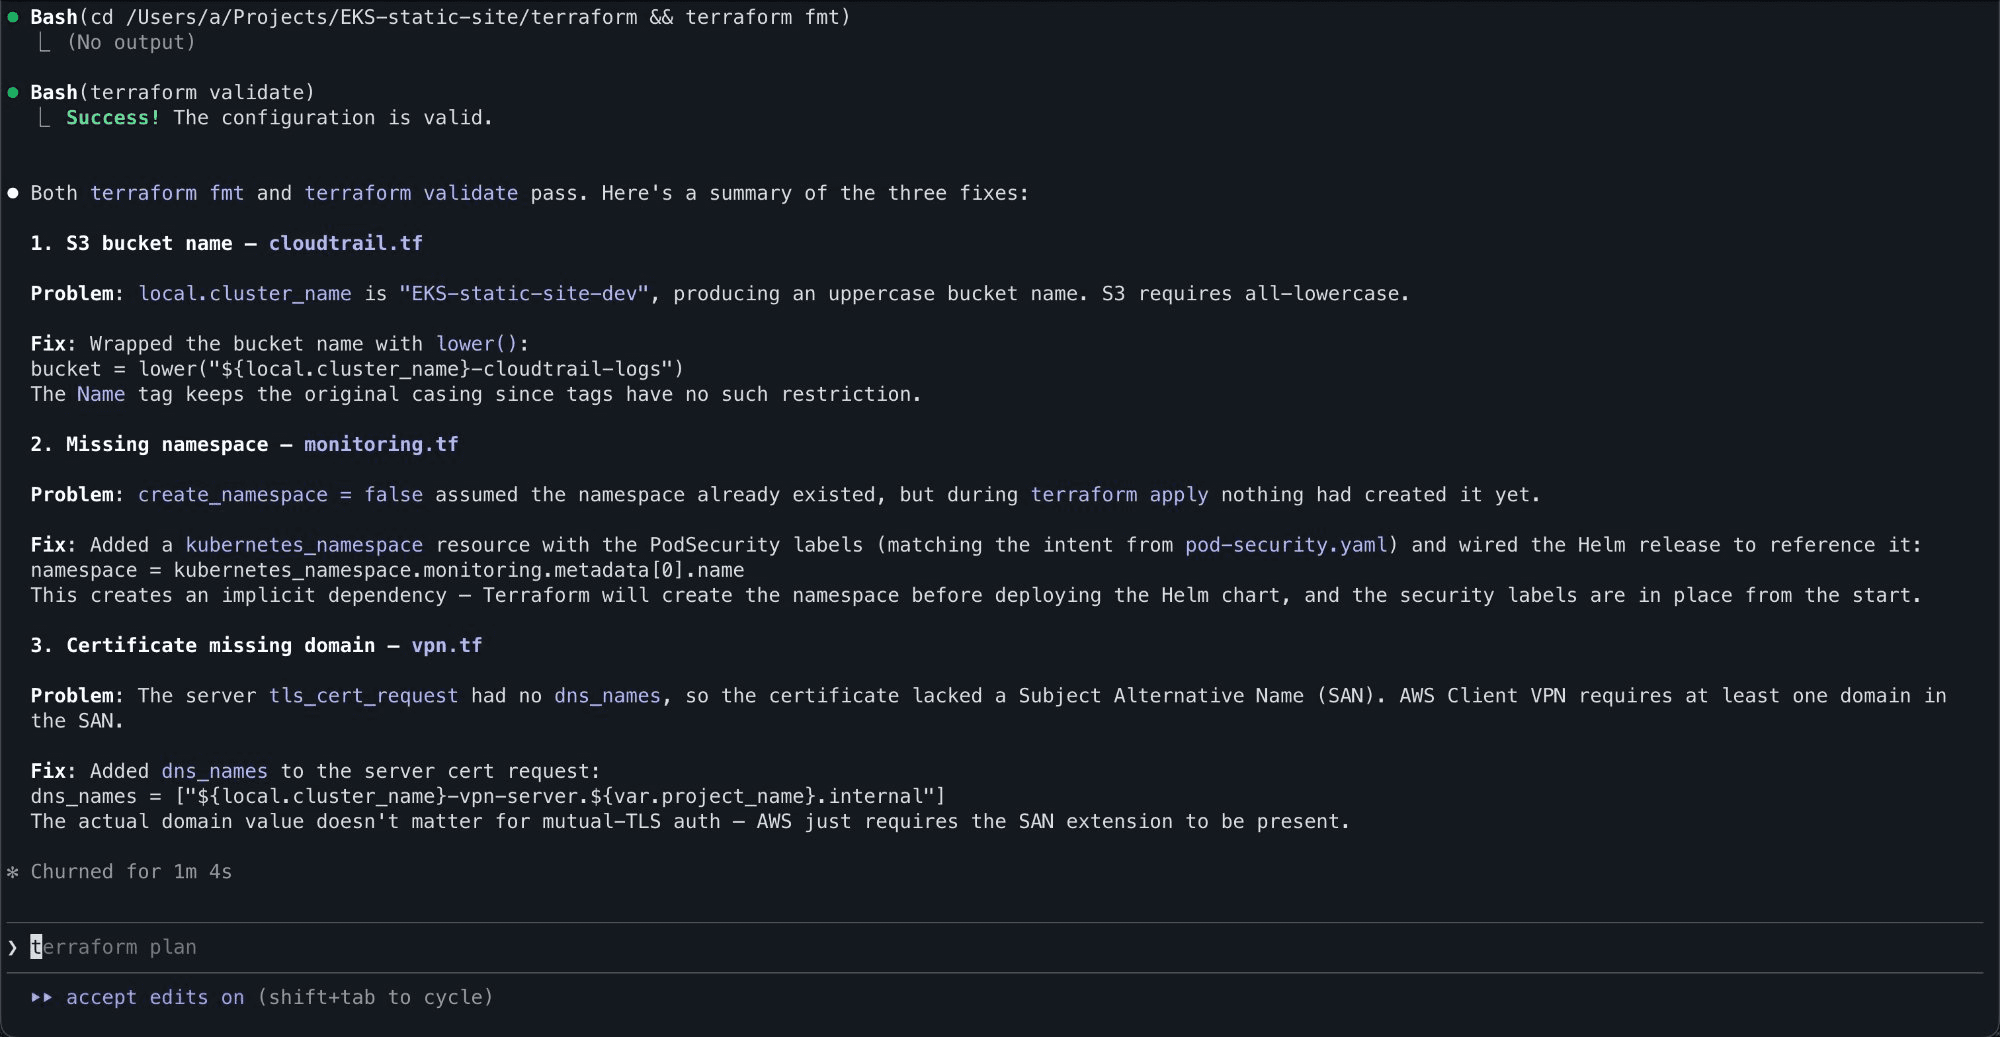
3 issues being diagnosed and the root cause/fix being explained
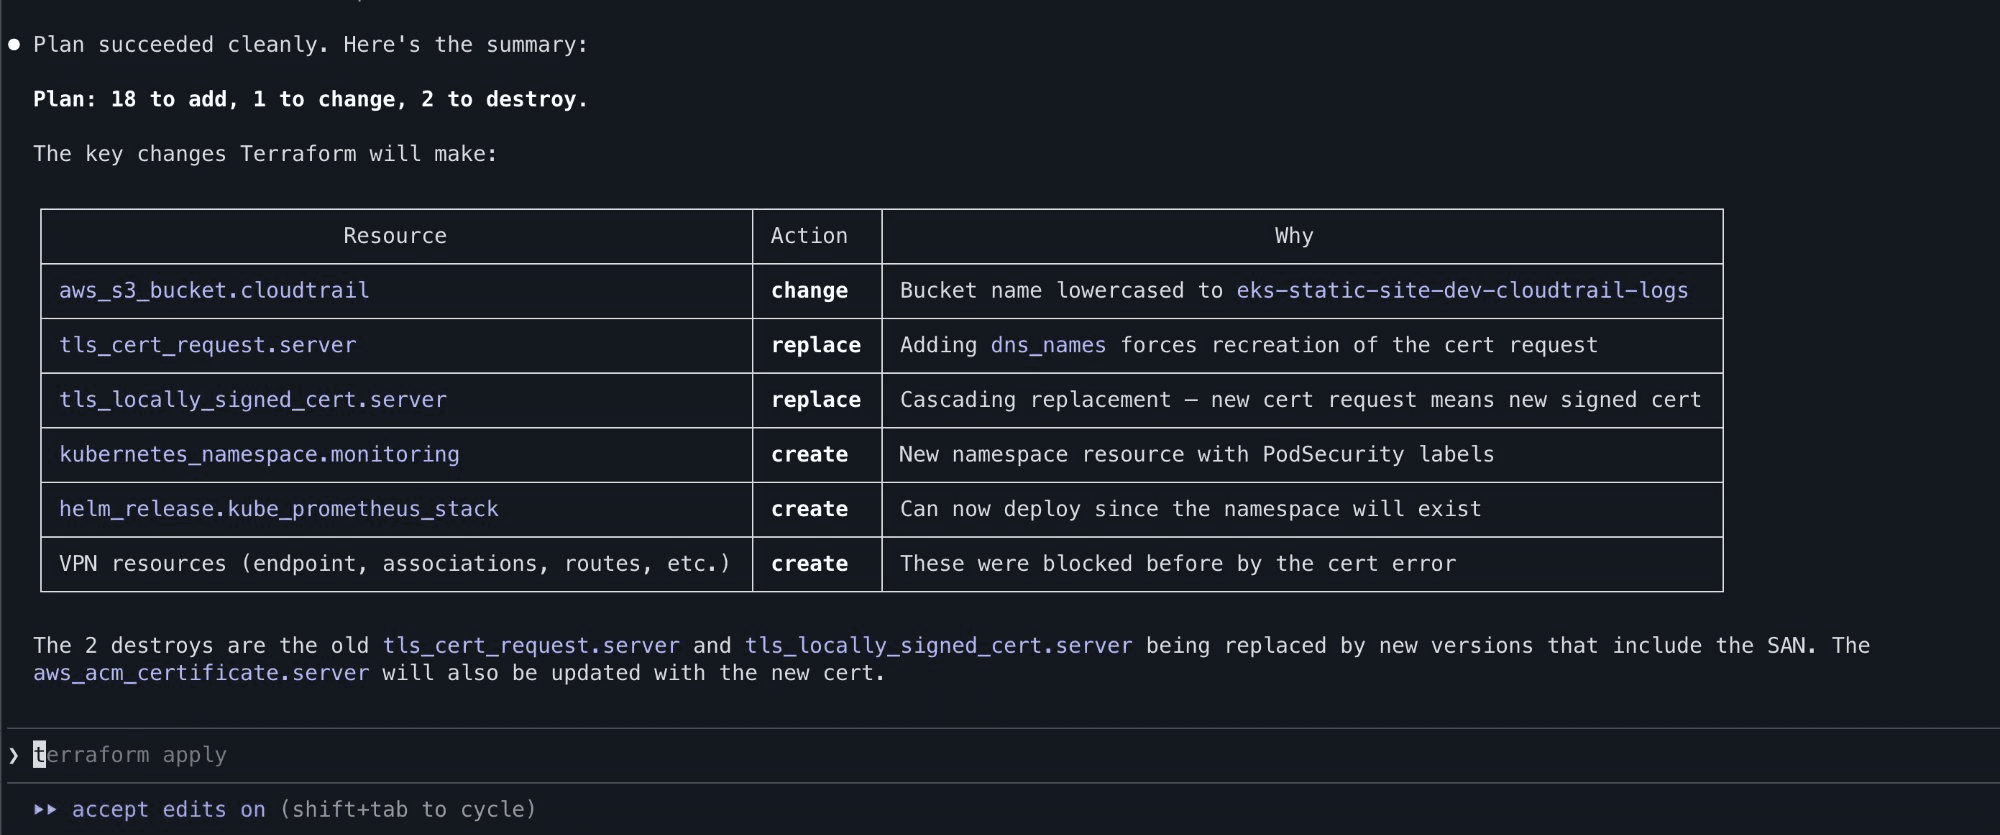
Clean reapply after fixes are implemented. Only the failed resources are taken into consideration and not everything created before
Refinement: Lessons Learned That Compound
This is where the process gets interesting. After fixing all five issues, I updated two things:
The agent prompts. Each affected agent got explicit guardrails added. The AWS infrastructure agent now mandates lower() on all S3 bucket names. The VPN agent specifies that client CIDRs must be in a different RFC1918 block from the VPC. The Kubernetes security agent notes that monitoring namespaces must be enforce: privileged for node-exporter. The Prometheus agent requires 900-second Helm timeouts and namespace dependencies.
A lessons learned file. A lessons learned.md that documents every issue with the problem, fix, and which resources it applies to. This file gets copied into every new project automatically, and the orchestrator is instructed to read it before dispatching any agents.
The result is that project number two should be cleaner than project number one. This is the same pattern that experienced engineers carry in their heads, except here it's codified and shared across every future project.
The End Result
After working through the fixes, all seven stages completed successfully. The full stack was live:
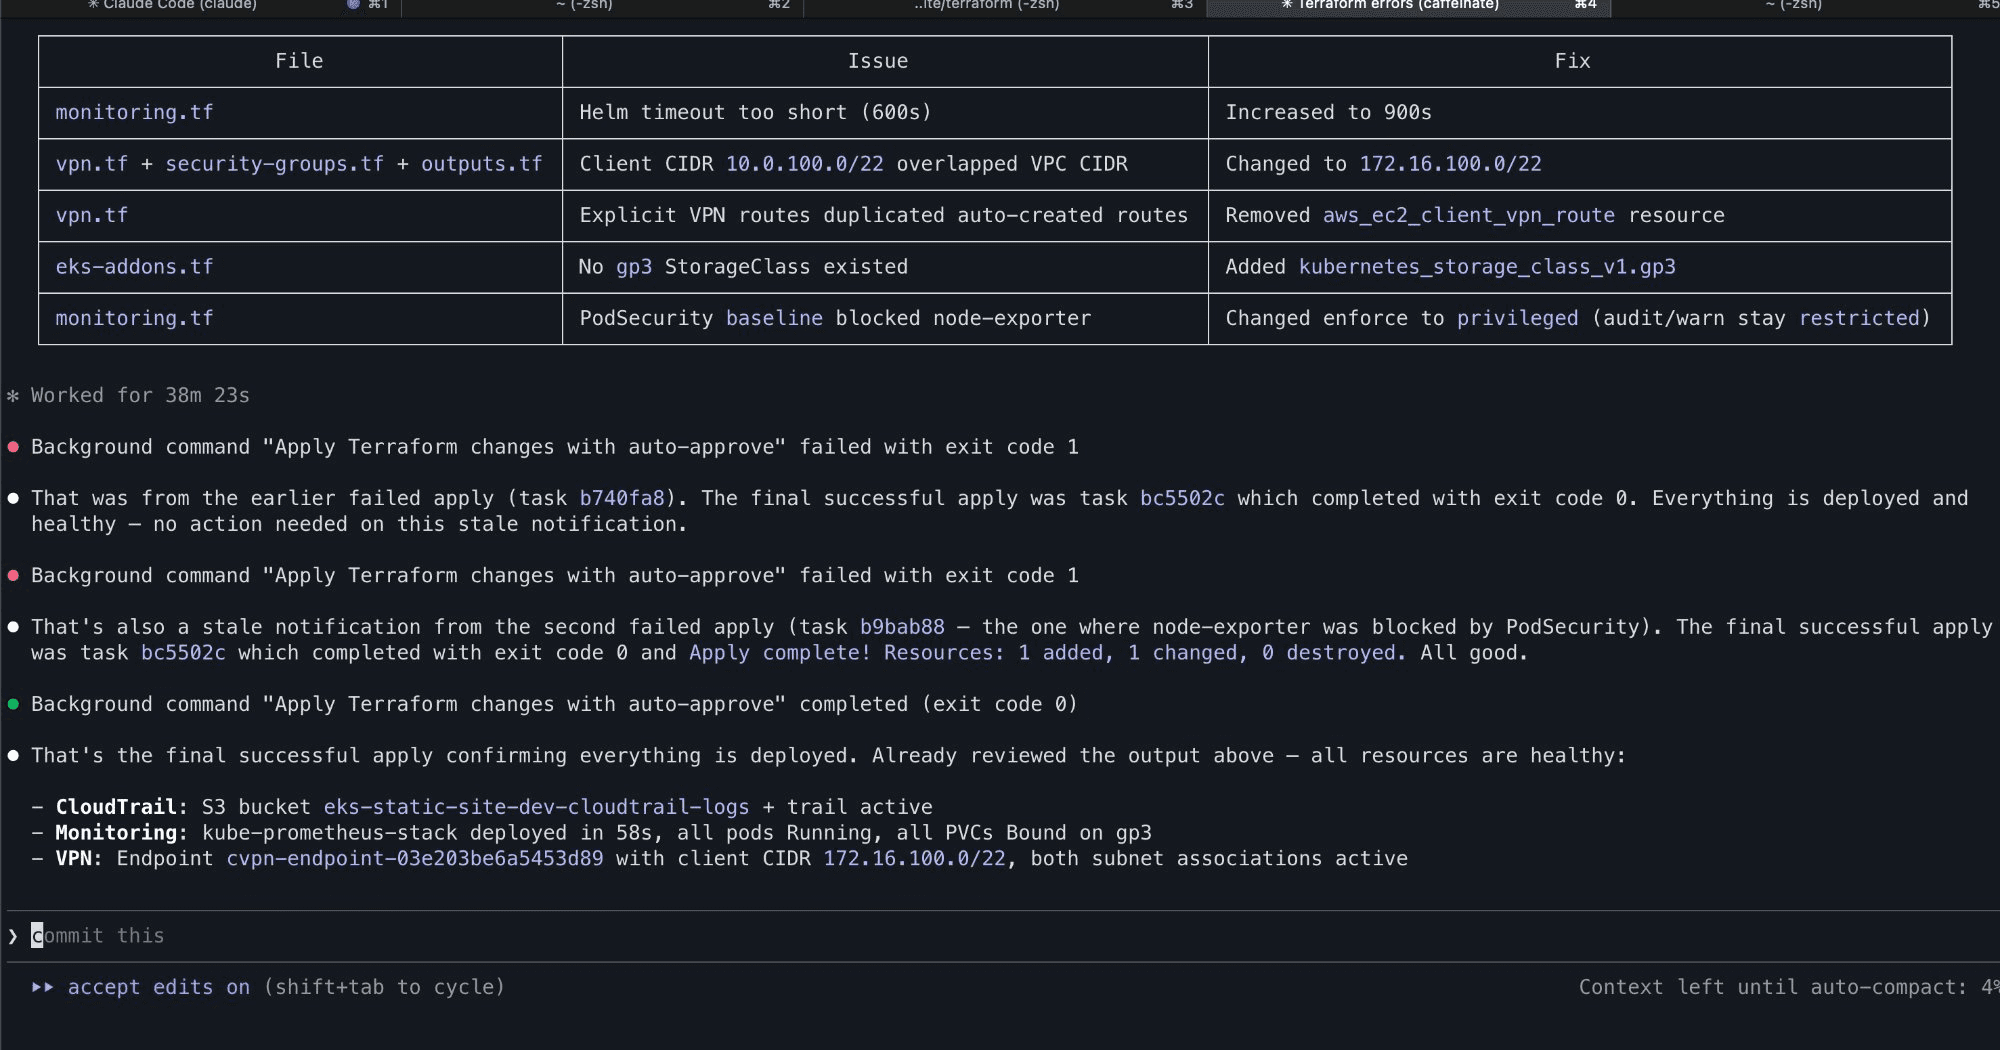
All stages complete, fixes applied, and everything healthy
Kubernetes manifests applied, NetworkPolicies, Grafana dashboards, RBAC, PrometheusRules, all deployed to the cluster via Kustomize:
K8 manifests applied
The Teardown Problem
One genuine issue, during teardown, the Terraform state bucket was destroyed before the main infrastructure, which meant Terraform lost track of what it had created. I had to manually verify and clean up resources through the AWS Console, checking EC2 instances, VPCs, NAT gateways, VPN endpoints, KMS keys, CloudWatch log groups, and S3 buckets across the account.
This is a good reminder that agentic workflows don't remove the need to understand what's happening underneath. If I hadn't known how to audit AWS resources manually, I'd have had orphaned infrastructure silently billing me.
What This Means for Infrastructure Engineers/Sysadmins
This experiment tells me a few things:
Agentic workflows accelerate certain parts significantly. Writing boilerplate Terraform, Kustomize overlays, Helm values, and pipeline YAML is tedious. Having agents generate it, with proper security practices, tagging, and documentation frees you to focus on architecture decisions and review.
They don't replace understanding. Every error required knowing enough about AWS, Kubernetes, and Terraform to diagnose and fix it. The agents are amplifiers, not replacements. A junior engineer using this system would learn faster, but they'd still need to learn.
The three-tier architecture works. Separating orchestration from execution from workflow definitions is the right pattern. It means you can add new agents (ECS, Lambda, etc.) without rewriting the orchestrator, and add new workflows without changing the agents. It's extensible in the way that a monolithic prompt is not.
Prompt engineering is infrastructure engineering now. The difference between the agents failing on five known issues and catching them all was a few dozen lines of markdown. The quality of your agent prompts directly determines the quality of your infrastructure output. This is a skill worth investing in.
What's Next
The blueprint currently covers EKS and AKS with Prometheus/Grafana monitoring. The natural extensions are:
Simpler compute agents — EC2, ECS Fargate, Azure Container Apps for workloads that don't need Kubernetes
Database agents — RDS, Azure SQL, with backup and replication patterns
Networking agents — Transit Gateway, VNET peering, cross-account access
Compliance agents — automated CIS benchmark reporting, SOC 2 evidence collection
Cost optimisation agents — right sizing recommendations, reserved instance planning
The three-tier architecture supports all of this without structural changes. Add an agent, add a command, update the orchestrator.
The broader question is whether this is the future of infrastructure management. After running it end to end, I think the answer is yes. Not because it's perfect today, but because it improves with every deployment. The lessons compound, the agents get sharper, and the gap between generated infrastructure and production-ready infrastructure narrows.
We're not there yet. But we're closer than I expected. AI didn't remove the need for an engineer. It accelerated execution. Architecture, security, lifecycle management, and cost discipline still require judgement. That's not replacement. That's leverage.


